VFA Registrations Monthly Comparison Chart – 2008 - 2012 - 2016 - 2018
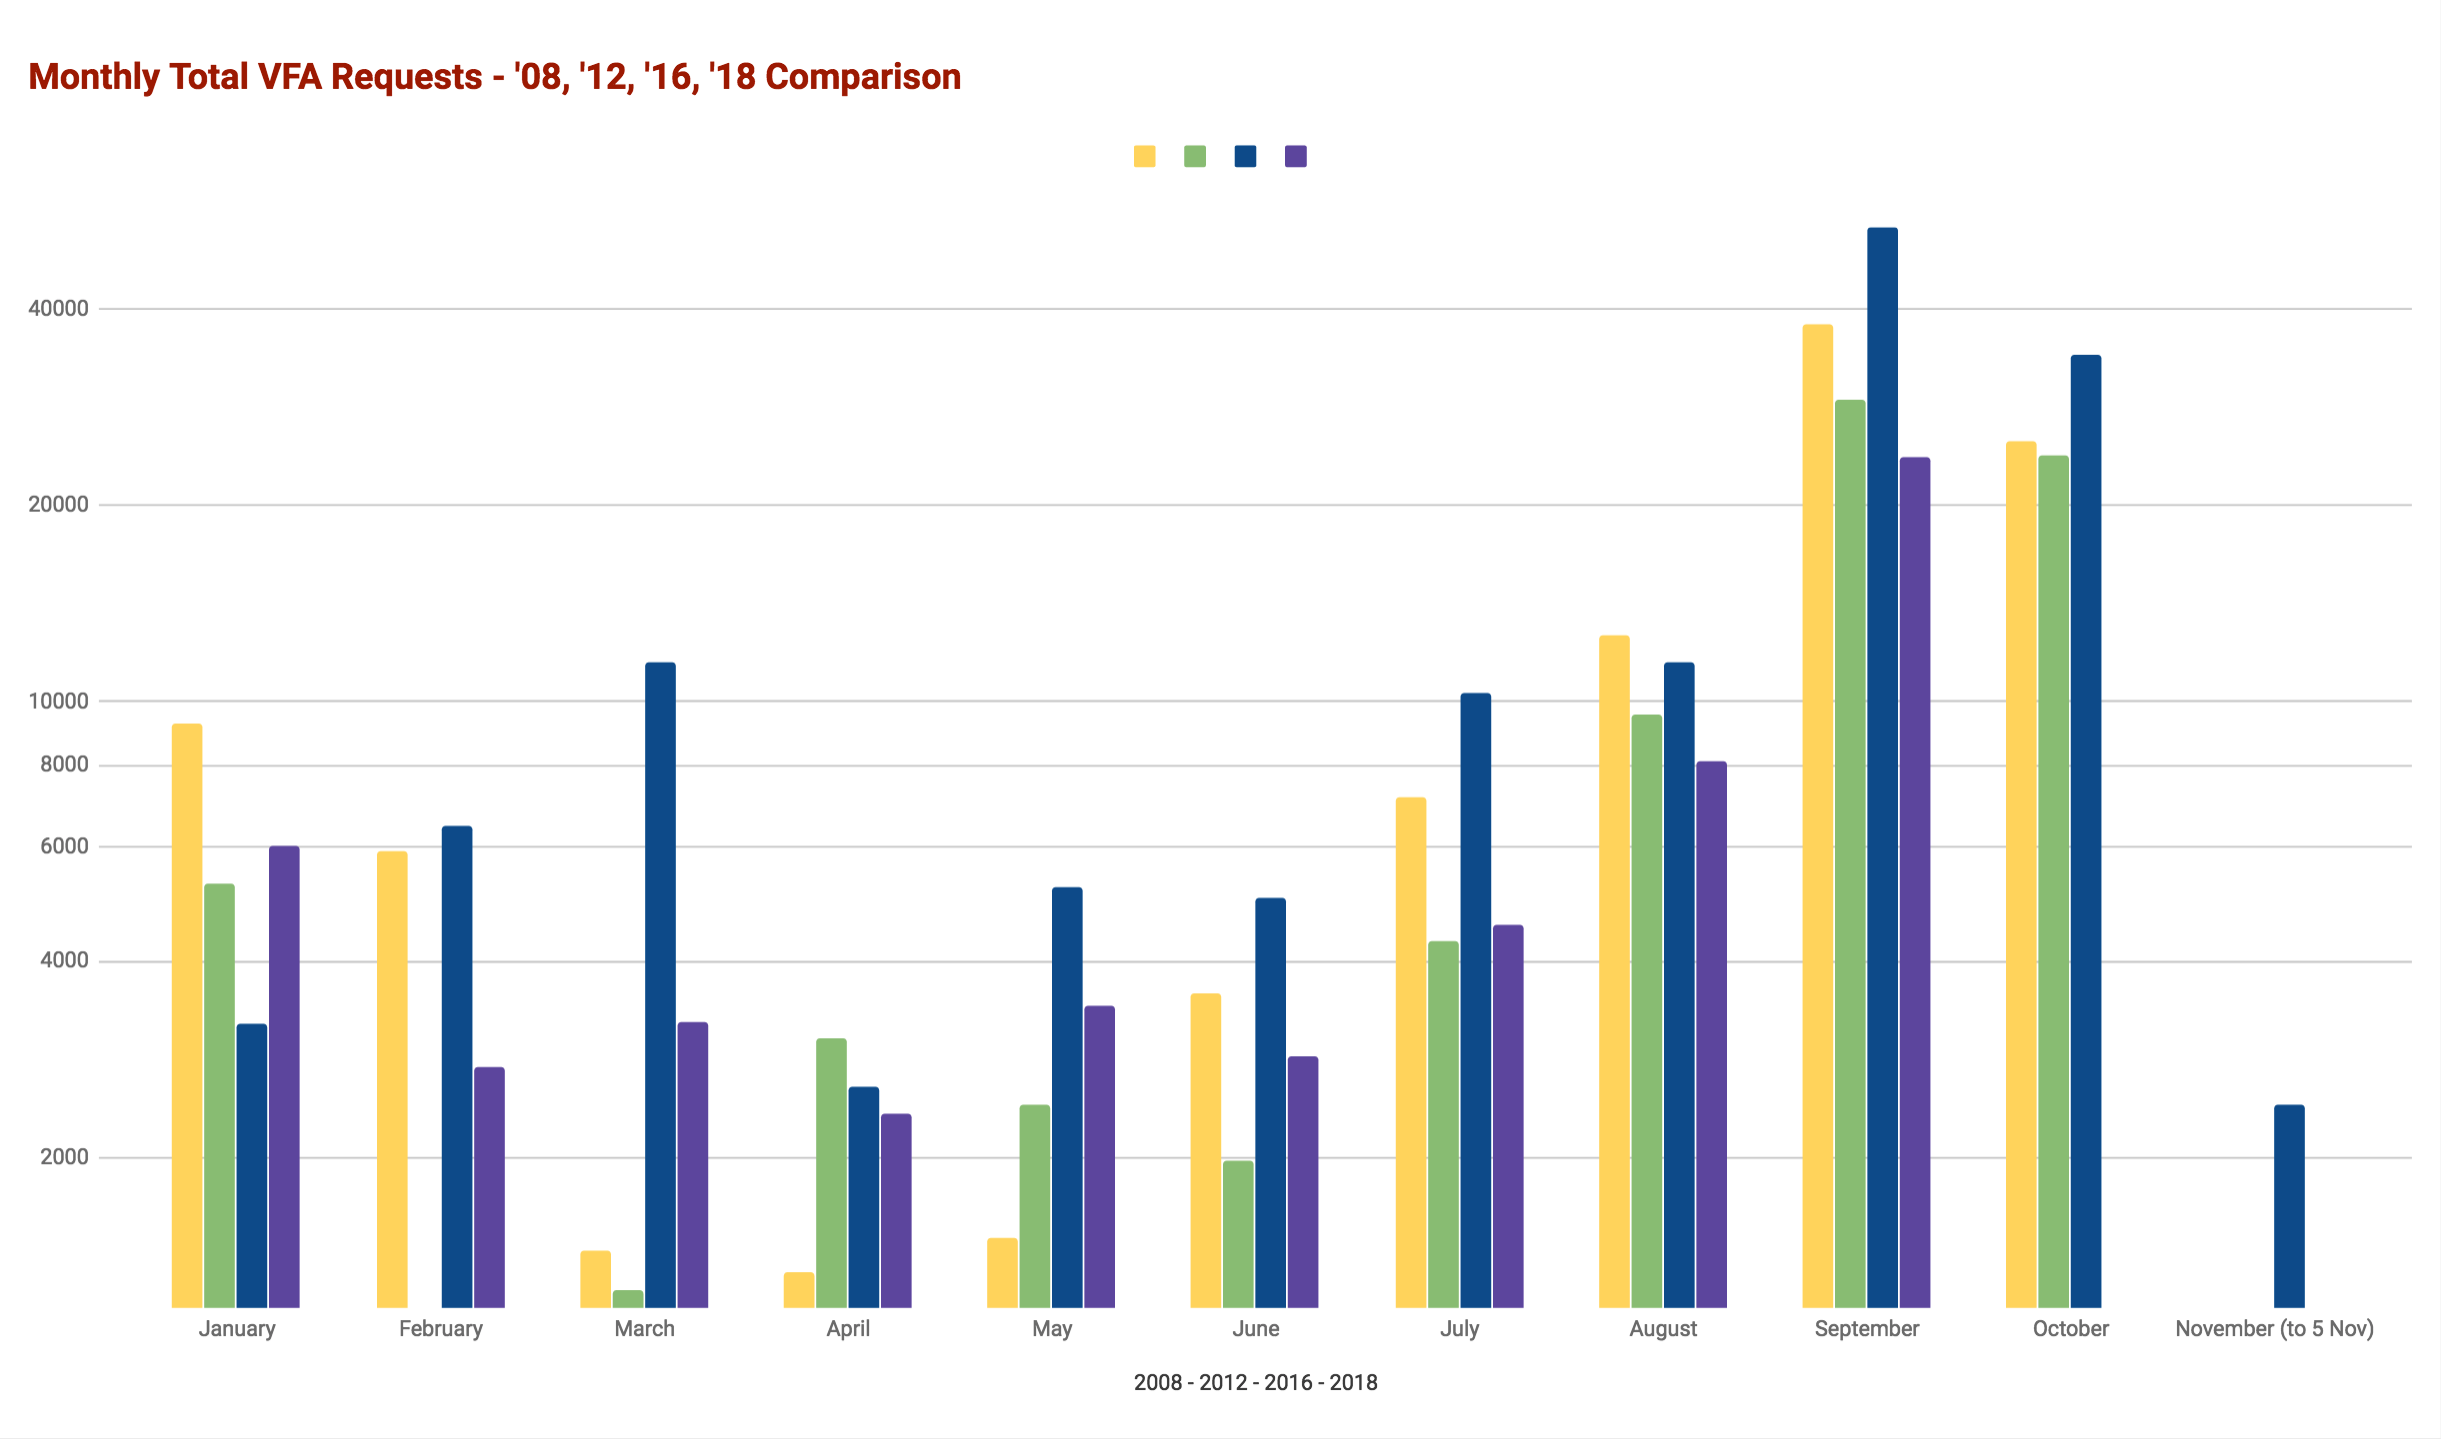
Important Note: Chart vales show a Logarithmic scale vs. a Linear/Arithmetic scale
(The top of the chart shows the range of 20,000 to 40,000 users, while the lower part displays numbers between just 2,000 and 4,000 users.)