/
Month-by-Month Chart 08-12-16-18
Month-by-Month Chart 08-12-16-18
- Merrill Oates -HU, Wiki
Owned by Merrill Oates -HU, Wiki
VFA Registrations Monthly Comparison Chart – 2008 - 2012 - 2016 - 2018
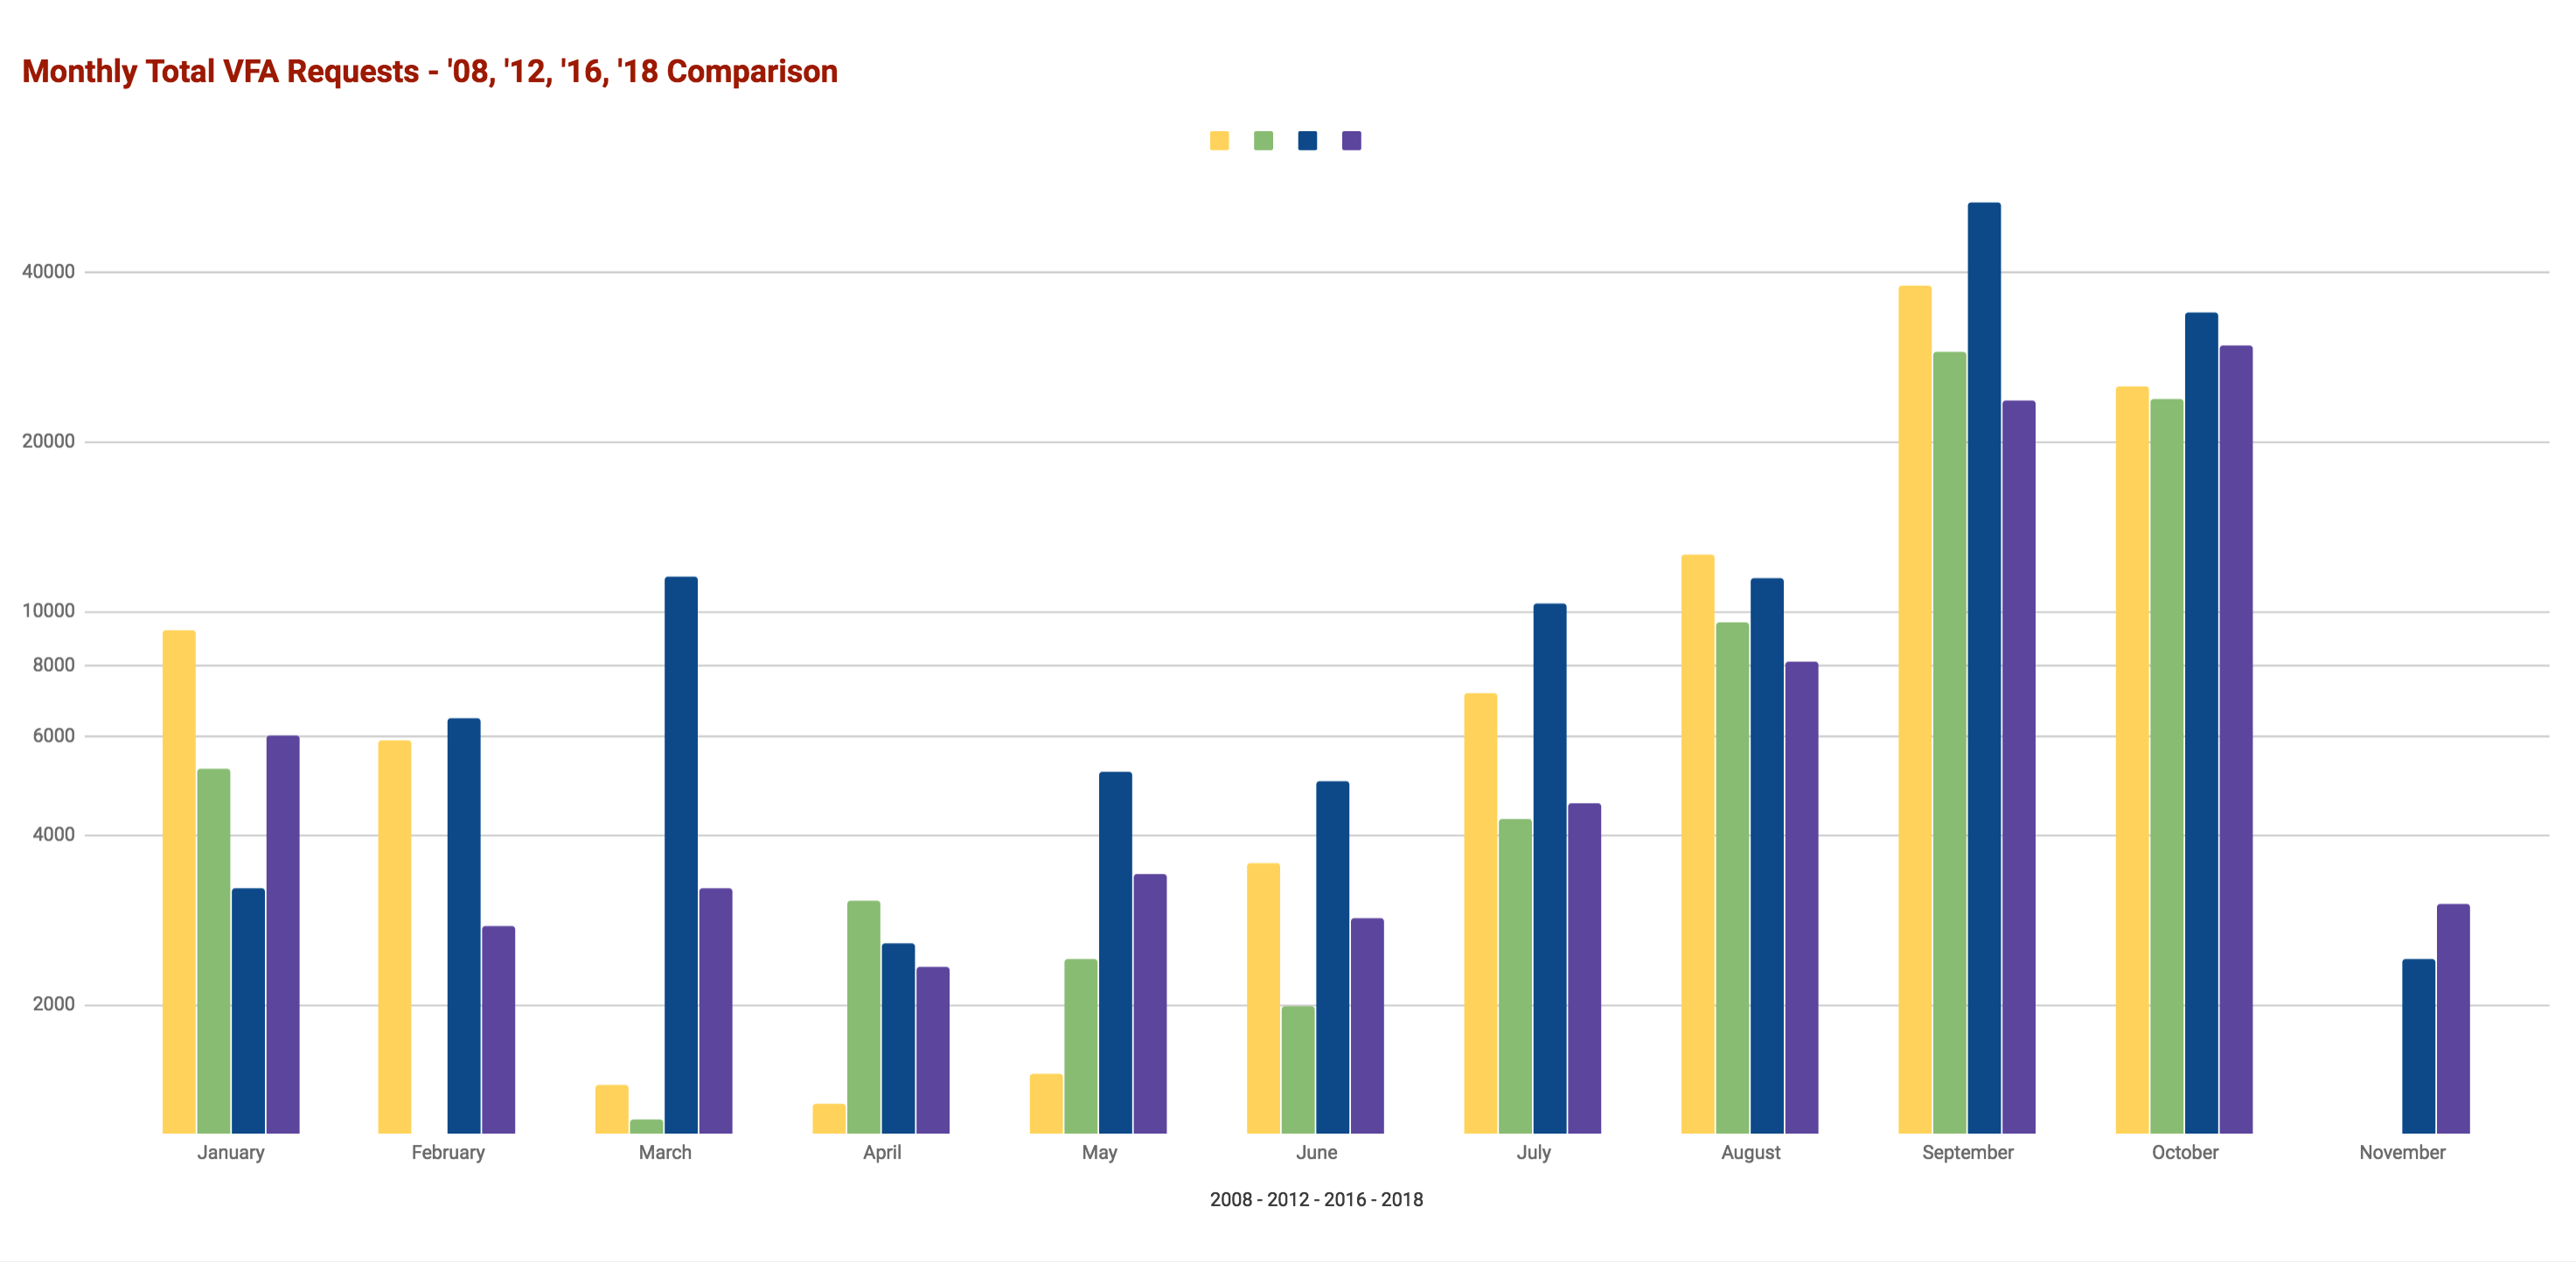
Important Note: Chart vales show a Logarithmic scale vs. a Linear/Arithmetic scale
(The top of the chart shows the range of 20,000 to 40,000 users, while the lower part displays numbers between just 2,000 and 4,000 users.)
The following macros are not currently supported in the footer:
- style